
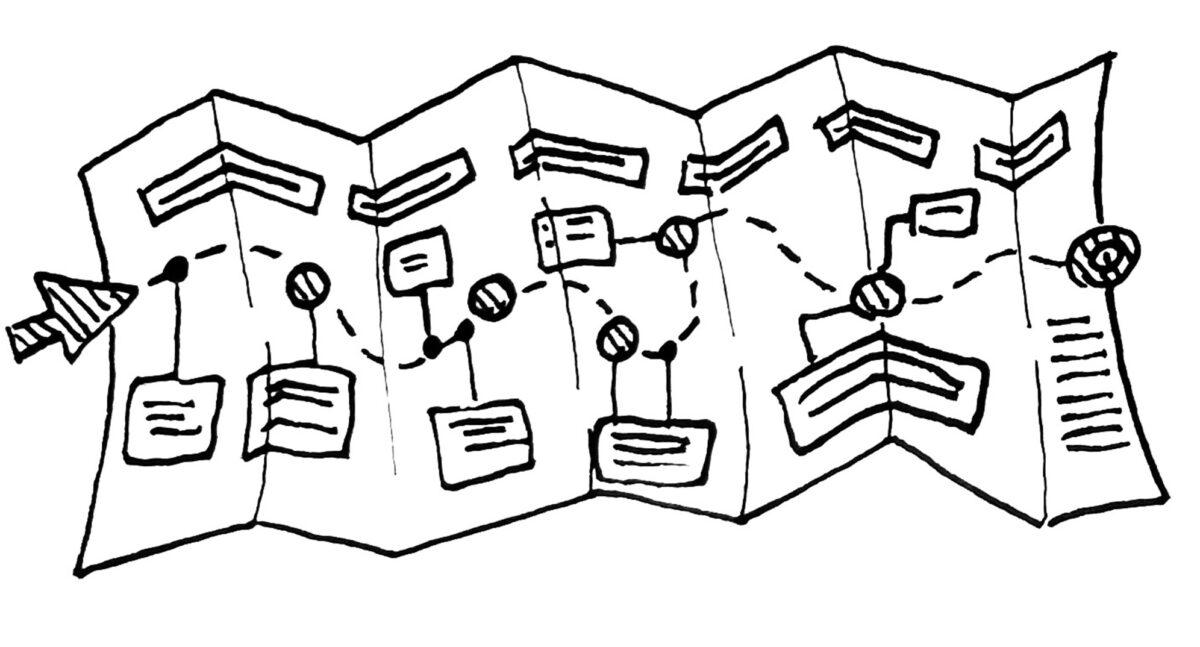
A user journey map “is a visualization of the experiences people have when interacting with a product or service, so that each moment can be individually evaluated and improved” (Martin & Hanington, 2012:25).
This is done by documenting the events and interactions that a particular user group experience. This helps place a product or service in a much larger context, in the real world and over time. This also helps the design team to identify what they know of the journey, and where knowledge gaps exist. It provides insight into areas to explore and further questions to be answered.
It is key to note that creating the user journey map alongside personas early in the design thinking process helps facilitate conversations and identify the next steps. These should be informed by rich, qualitative interactions between the design team and the user groups. A team can begin with one user journey, observe, and update the journey map as they obtain more knowledge on specific parts of the journey.
Steps:
- Decide who is the main character(s) of this journey map. From whose perspective are you mapping out this experience?
- Synthesize the research done by the design team. This can be observations, interviews, and walkthroughs of the person’s experience.
- Put up the collected data (stories, anecdotes, photos) on a wall.
- Consider the following elements. Check and ask yourself if there are the following:
- Personas/User Groups: the main characters that illustrate the needs, goals, thoughts, feelings, opinions, expectations, and pain points of the user.
- Timeline: a finite amount of time (e.g. 1 week or 1 year) or variable phases (e.g. awareness, decision-making, engagement/use, renewal).
- Emotions: How are they feeling? (frustration, anxiety, happiness, etc.).
- Touchpoints: customer actions and interactions with the organization. This is the WHAT the customer is doing.
- Channels: where interaction takes place and the context of use (e.g. website, in person, social media). This is WHERE they are interacting.
- In-Betweens: moments of transition, stagnation, or inaction.
- The semblance of a ‘journey’ begins to take shape. Note commonalities, differences. Use arrows to connect, to show divergence. Map out the sequence to which things take place.
- Depending on the intended use of the journey map, transfer the information onto a software (e.g. Visio).
- After assembling your user journey map, you can ask the following questions for debriefing:
- Note areas where you notice a lack of information, where potential research or observation can take place.
- What are parts of the experience or journey that you want to know more?
- What are the implications of doing this in your own work?
Considerations:
- Consider triangulation in your data collection. How can you use multiple methods of data collection to ensure that you are getting a complete picture of the user’s journey with as little-observed bias as possible? For example, use client interviews, staff observations, and client journals to get a rounded picture.
- Consider how you’re validating your data and the user map. Use characters themselves to validate the conclusions made.
- Remember that the ultimate goal is not to just resolve a few pain points but to improve the client’s entire user experience. Thus continue to probe and avoid taking shortcuts in seeking to map out the entire journey map of the user (Thompson, 2017).
References:
- Howard, T. (2014). Journey Mapping: A Brief Overview. Communication Design Quarterly. 2.3. p. 10-13.
- Marquez, J.J., Downey, A., and Clement, R. (2015). Walking a Mile in the User’s Shoes: Customer Journey Mapping as a Method to Understanding the User Experience. Internet Reference Services Quarterly, 20:135–150,
- Thompson, M. (2017). Common Pitfalls in Customer Journey Maps. Interactions. p. 71-73.
